We crave black-and-white certainty, but are not good at grey. What can earthquakes and eclipses teach us about climate deniers’ greatest asset & climate activists’ greatest challenge – uncertainty?
A party trick to tell how certain people are
Here’s a fun pop quiz to test how much people tend to think about stuff.
Ask anyone, childhood friend or total stranger, ‘Tell me one thing you absolutely know 100% for sure to be true’.
The answers can be fascinating, but they’re not the point of this test. More revealing, is how fast they answer. Speed of response indicates that individual’s degree of reflectiveness.
Many can answer without hesitation – they’re sure they’re sure. Others might still be scratching their heads hours later, stopping themselves mid-sentence every time they try to assert something they know to be 100% true.
There’s a spectrum. The longer someone takes, and the more deeply they ponder the question, the less certain, or more questioning, you now know them to be.
Of course a quick answer could be a sign they’ve done a lot of pre-thinking. Having an answer ‘off the top of your head’, even when ambushed with such an uncommon question, could mean you’ve spent ages working something out, and are simply jumping at the chance to share your insight.
Religious people, for example, often have an expression of their faith to hand. People with strong political views also tend to easily access confident assertions. Scientists and mathematicians may have some ready-made responses that jump to mind.
But this question is not meant to diagnose philosophy, but personality. It’s a reflection on reflection.
Asking what people are certain about offers an insight into an individual’s cognitive habits, and highlights a key challenge to tackling climate change: certainty.
Earthquakes, eclipses and certainty
It’s nice to know things for sure. We know where we stand. Or do we?
Anyone who’s experienced a seismic tremor when standing outside knows how profoundly scary it is to suddenly discover a certainty you’ve known since you learned to walk turns out not to be 100% true all the time.
From infancy we learn instinctively, and are told proverbially, that nothing is ‘as solid as the ground beneath our feet’. When we feel the earth move, we suddenly learn this isn’t true.
Find yourself in the wrong place at the wrong time, and the notion of the ground being quintessentially solid turns out to be a useful, practical rule of thumb, rather than an eternal truth. It’s a certainty that may serve us well 99.99999% of the time, but is not 100% true all the time.
If you’re lucky enough to live somewhere geologically stable, there might only be a 0.000001% chance of you ever experiencing an earth tremor when standing outside. This is not a rounding error, but a demonstration of the importance of nuance, numbers, context, and understanding of risk.
It’s why it’s important to distinguish between personal lived experience and scientific fact. It’s the difference between belief and proof, experience and evidence, weather and climate.
And, as a species, the difference between continuing to blast away at what remains of our feet, and starting to staunch the bloodbath and repair the damage.
Case study 1: earthquakes
We just made up those percentage numbers for illustrative purposes, because there’s huge variability in seismic activity. For residents near the Circum-Pacific Ring of Fire’, where 81% of our most powerful earthquakes occur, perceptible tremors are commonplace. Parts of Wyoming, by contrast, may not have experienced any seismic activity for more than a billion years.
So any individual’s certainty about the solidity of the earth’s surface simply reflects 100% of their personal experience so far.
New information means you have to reassess old certainties, and ascribe new degrees of uncertainty.
Case study 2: eclipses
Rarer even than earthquakes, total solar eclipses provide a more universal challenge to ‘common sense’.
Another proverbially 100% certain truth is that night follows day. The sun only disappears at night. Inuit living above the Arctic Circle know that even if the sun hides below the horizon during the winter, it certainly doesn’t disappear momentarily between rising and setting.
Yet every now and then, our moon just happens to briefly occlude our sun. Partial eclipses happen a few times a year, mostly for a few seconds, often imperceptibly. Total eclipses, where the sun disappears completely, only occur every 18 months or so, casting very narrow, very brief ‘paths of totality’ on the Earth’s surface. As 70% of this is ocean, our individual odds of encountering a total solar eclipse are even longer.
For most of human history, we’ve relied on shamans and priests to provide supernatural explanations, post-hoc. Depending on where you happened to be, wise men would tell you they were caused by dragons, serpents, Eternal Bats or Celestial Jaguars. And you’d be certain they were right. 100%.
Not long ago, advances in optics enabled more questioning individuals to compile detailed observations, deduce an astrophysical explanation, even to predict future eclipses. Pioneers like Copernicus and Galileo were condemned as heretics, but proved correct.
By the 1920s, 3 leading astronomers calculated ‘in the long run a total eclipse happens at any given station only once in about 360 years“. This means that until science and modern communication enlightened us, most people lived and died only hearing about total eclipses from distant ancestors.
Computers enabled even more precise modelling. Jean Meeus, a Belgian astronomer born two years after the 1926 publication of Russel, Dugan & Stewart’s Astronomy, revealed this 1-in-360-year event is actually a considerable approximation. Meeus number-crunched more nuanced, specific and detailed predictions of the intervals between total solar eclipse at different points on the Earth’s surface.
He revealed that where you happen to live makes a huge difference. At the turn of the millennium, residents of areas to the north of the Angolan town of Lobito saw two total solar eclipses within 18 months. 4-year-old rural Angolans could dismiss total eclipses as ‘meh’.
Records don’t reveal how many people were present in what’s now known as Los Angeles on May 22nd 1724 to see the solar eclipse. But thanks to Meeus, we know no one in LA will see another one for 1,565.9 years, as their next chance will be April 1st 3290.
If Hollywood, on the Ring of Fire, but in an eclipse blind spot, relied only on the personal lived experience of its residents, they’d make many movies about earthquakes, and none about eclipses.
The march of science – forward or backwards?
Our ancestors weren’t stupid, just ignorant.
Humans have existed, at the most, for 300,000 years. Our understanding of the physical causes of earthquakes and eclipses are very, very recent. The Inquisition condemned Galileo’s theory of heliocentricity in 1615, meaning we’ve been in the dark about eclipses for the first 99.87% of human history. We’ve evolved to accept ancient wisdom and fear the new. Good for avoiding toxic mushrooms, disastrous for taking action to mitigate the impact of global heating.
Our ability to process new information is limited. Since Galileo and his telescopes kicked off our reappraisal of our place in the universe, we’ve struggled to keep pace.
Over the past 300 or so years, the explosion of questioning, observant people with access to new technology has transformed our culture. The discoveries of Newton, Darwin, Bohr, Einstein, Watson, Crick & Franklin, have radically changed our understanding of the universe and our place in it.
But where is the March of Science taking us? Until the planetary consequences of our fossil fuel addiction started to dawn on us, those leading the Industrial Revolution had no doubt it was ‘advancing humanity’.
But as our invention of new technologies races ahead of our capacity to understand, let alone regulate their consequences, it’s now looking more like we’re running backwards at an ever-increasing rate.
No sooner have we created one self-inflicted existential threat – carbon emissions – than we started adding others: population growth, nuclear annihilation, genetic manipulation and now AI.
Homo sapiens – it’s all about us
Ironically, each scientific great leap forward has diminished our status in the ecosystem. We started as the stars of our own show, but each conceptual breakthrough further demoted homo sapiens, nudging us down the bill. Bit by bit, we’re realising we’re just very recent stars who may burn out before we have a chance to understand what we’ve done. The Eddie Cochran species that killed itself before the cockroaches took over.
Even the term we awarded ourselves, homo sapiens, ‘wise man’, is starting to look hubristic. How smart can we be, if our brief ascendency guarantees our own extinction?
Over the 300 or so years since the Industrial Revolution sparked our appetite for coal, each technological discovery has increased our numbers, and cranked up the volume of our greenhouse gas emissions.
Over the last 150 years, since the invention of the internal combustion engine, we’ve transformed our planetary ecosystem.
We’ve only been grasping the consequences of the greenhouse effect for the past 50 years or so. That’s 0.02% of human existence.
We point this out not to excuse ourselves, but to impress how urgently we need to start learning from science, rather than playing with technology.
Three Charts From Panicking Scientists
All this philosophising is an attempt to frame these three charts into a context that spurs action rather than despair.
They weren’t scientifically selected, but chosen at random from a Twitter feed that follows expert thinking on climate modelling.
None is the climate change hockey-stick chart, tracking the sudden spike in atmospheric greenhouse gas concentration following the Industrial Revolution. That was first published in 1999, meaning
- It’s old news
- It’s still climbing at the same rate, nearly a quarter of a century later
These charts, however, are all up to date. Each shows different consequences of the same problem – our collective inability, so far, to significantly reduce our fossil fuel addiction.
Chart 1: sea temperatures
This graph measures the impact of all the energy being reflected back onto the surface of the sea, since 1982.
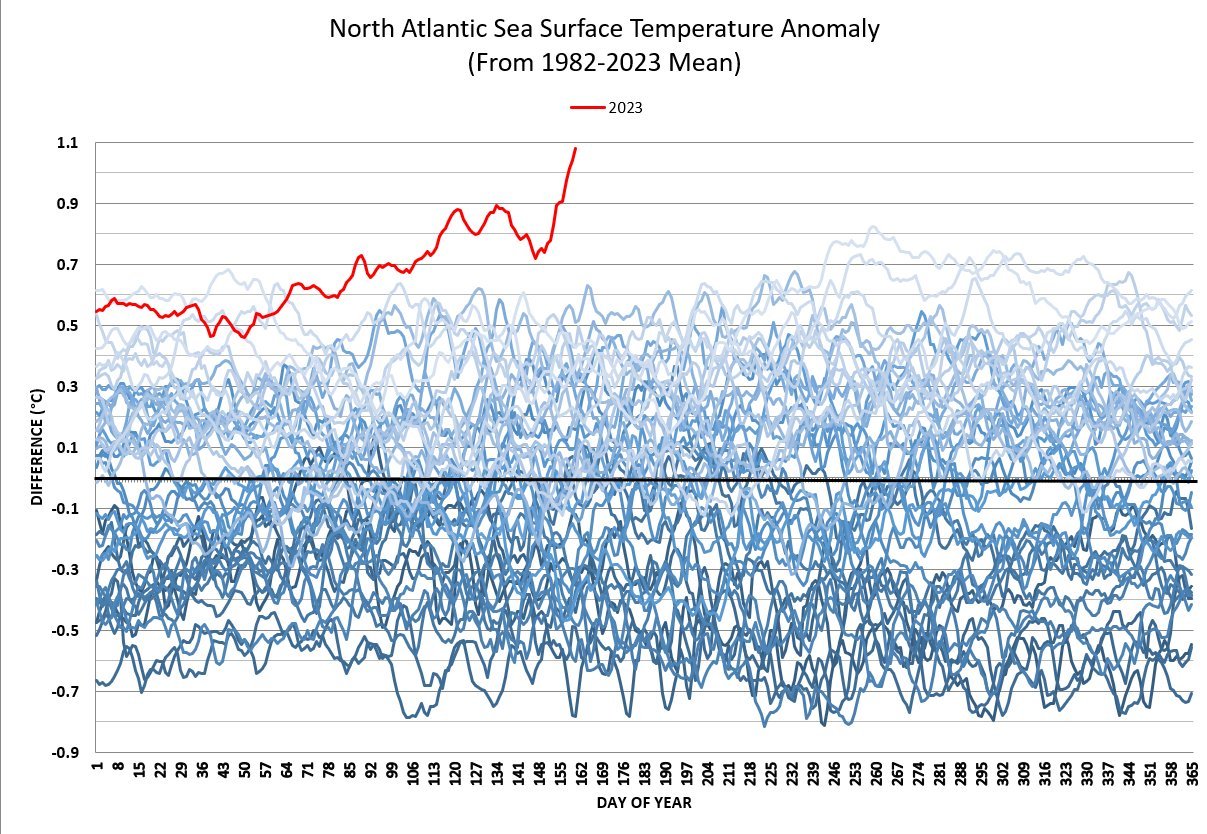
Here are the panicky words of one expert trying to alert us to its significance.
This is so unusual. That’s a *huge* amount of energy being transferred to the atmosphere. Expect extreme temperature and storm records. Just the top few metres of our oceans store as much energy as the entirety of our atmosphere. I’m very concerned for later this year into 2024.
Associate Prof @LSEGeography Environmental Change & Sustainability, Wildfire emissions & Modelling
Chart 2: air temperatures
This one measures temperatures 2 metres from the ground since 1979.
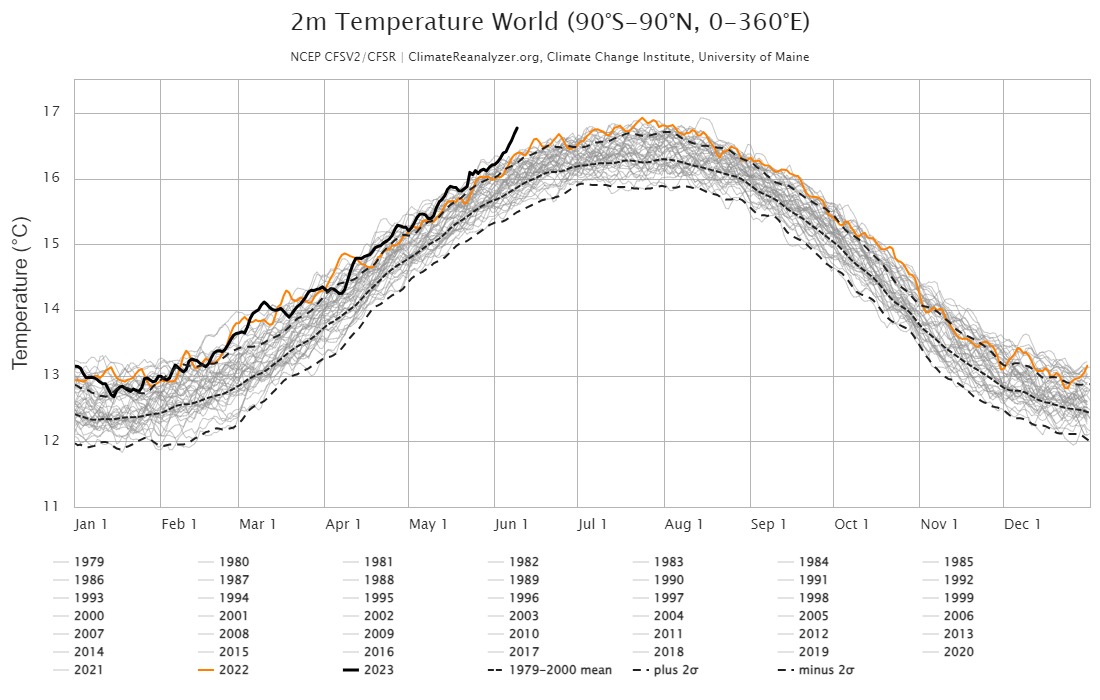
Here’s what the scientist flagging this chart said.
Recent temps make me think the climate is becoming unhinged and climatic feedback loops may be contributing. FYI: I did swear when I saw this, so feel free.
Distinguished Professor of Ecology-Oregon State University Director-Alliance of World Scientists Lead author “World Scientists’ Warning of a Climate Emergency”
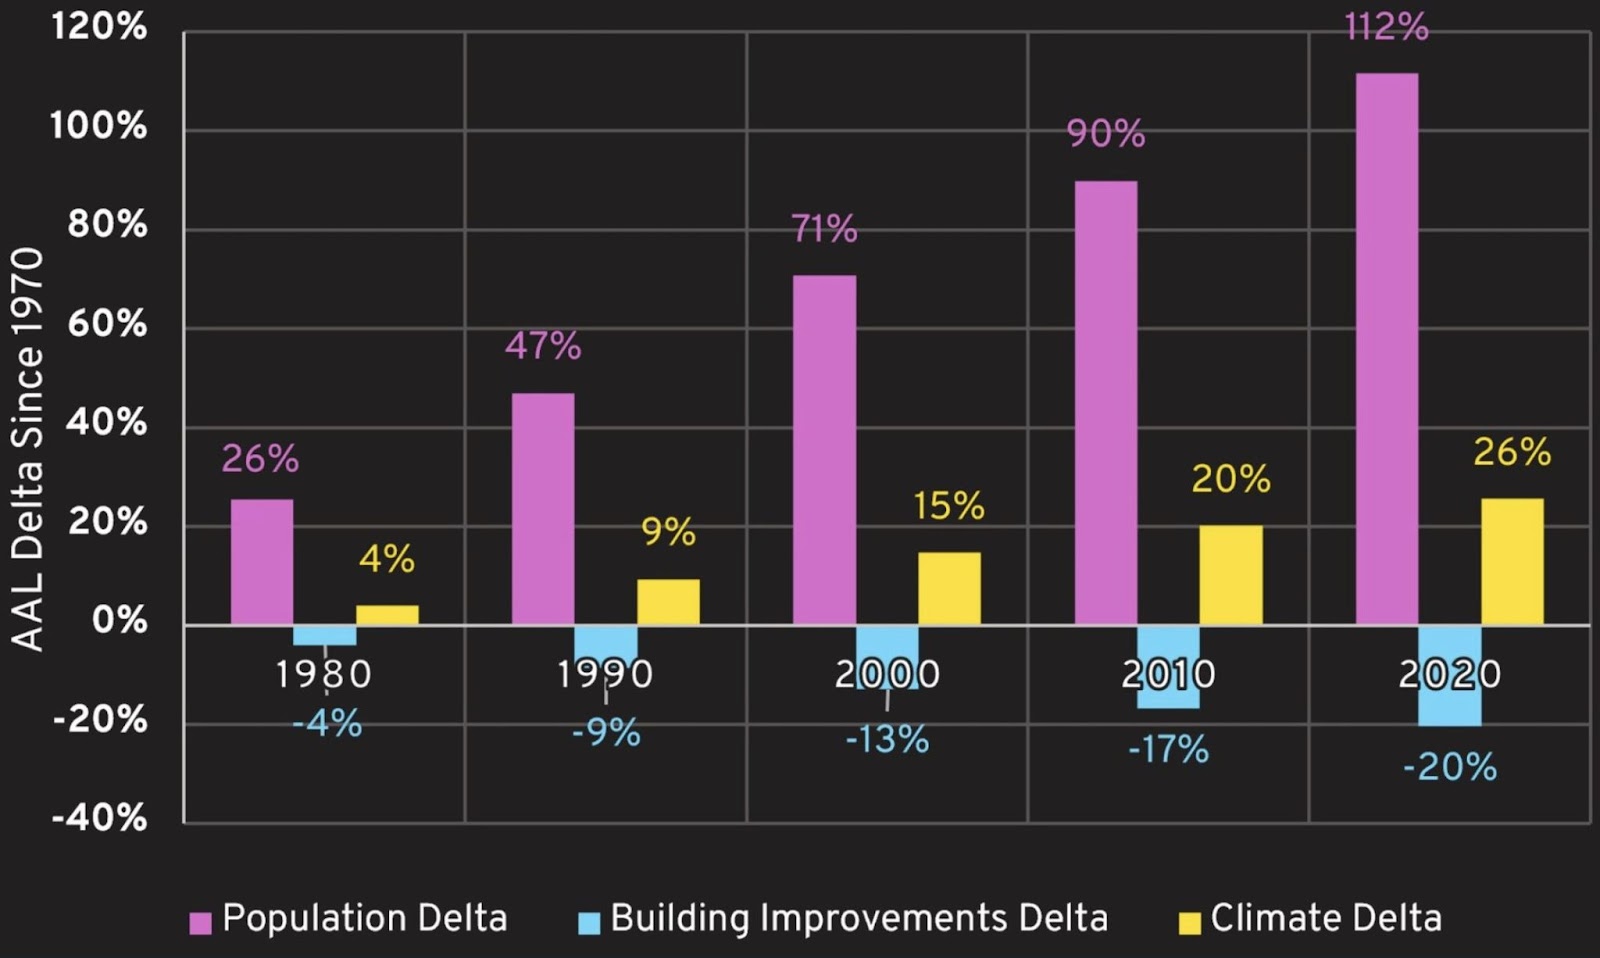
Chart 3: risk
This chart measuring AAL Delta needs a bit more explaining. Average Annual Loss is a metric used by the insurance industry, ‘a loss statistic that is widely used and has a diverse range of applications in catastrophe risk management’. Delta is a mathematical function representing the change in a variable. In finance and insurance, it measures volatility of risk.
Simply put, the bigger the number, the more unpredictable, and hence risky. An expert in measuring catastrophes created this chart to try to separate out the relative impacts, from an insurance perspective, of population growth, building standards, and climate change.
Follow
We see a lot of graphs showing historical losses couched in today’s money that are going through the roof in the last 50 years. I wanted to understand – in very crude terms – how much of this is population-forced, how much is climate-forced and how much we’re already adapting through improvements in building techniques and enforcement of codes.
Richard Dixon
Catastrophe Research @ Inigo Insurance | Visiting Research Fellow @UniRdg_Met | Assoc. Editor @RMetS Weather | PhD Meteorology | FRMetS
Off the charts
We don’t expect these charts, or any of the thousands of similar ones generated every day by scientists around the world, to change the world.
Experts have been producing similar shocking evidence for decades, but we’re still locked into our old model of thinking. Big Oil has done a splendid impersonation of the Inquisition, doing all it can to quash an inconvenient truth that threatens a status quo that benefits from inaction.
But it may be enough to shock one, two, three or more people into action.
The risk of confronting such awful truths is that it sends us directly from denial to despair. The scientists who research, observe and measure the impact of our collective folly somehow manage to stave off despair, and continue to get up every day to try to do something to change our course.
Why not join them?
Questioning what we know, and confronting the truth, however unpalatable, is our best chance of mitigating the worst impacts of human-induced climate change. Fortunately, we can be quite good at it.